


Kubernetes health, capacity and self-healing

See every cluster. Heal it before anyone notices.

APEX Kube Monitor watches your Kubernetes clusters: whether every application is up, how loaded each server is and how much storage each application uses on each server. It explains every problem with the steps that fix it, and restores high availability by itself when a server or an application fails.

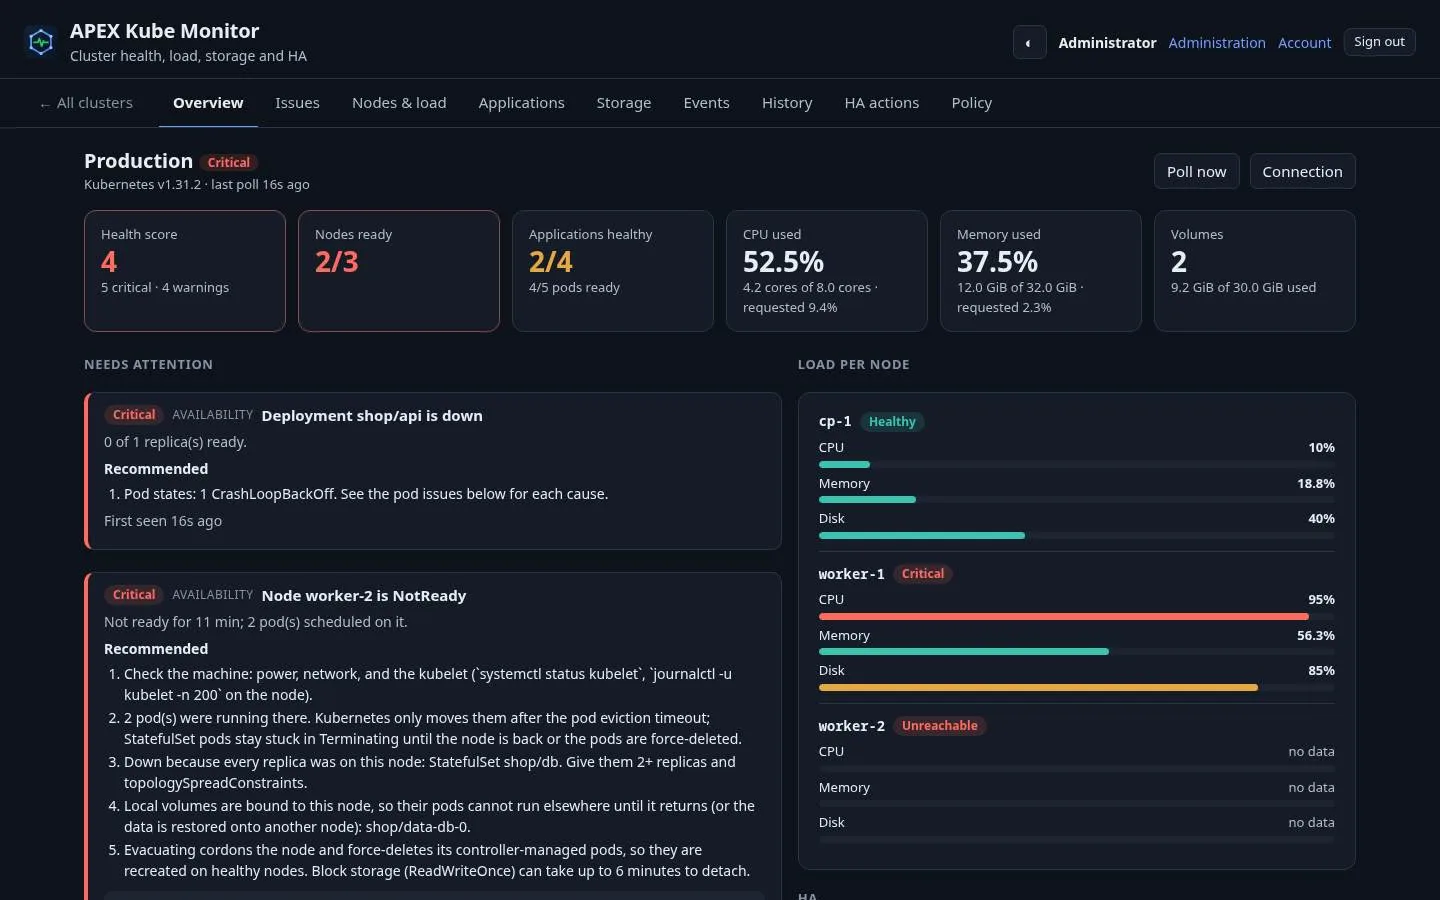
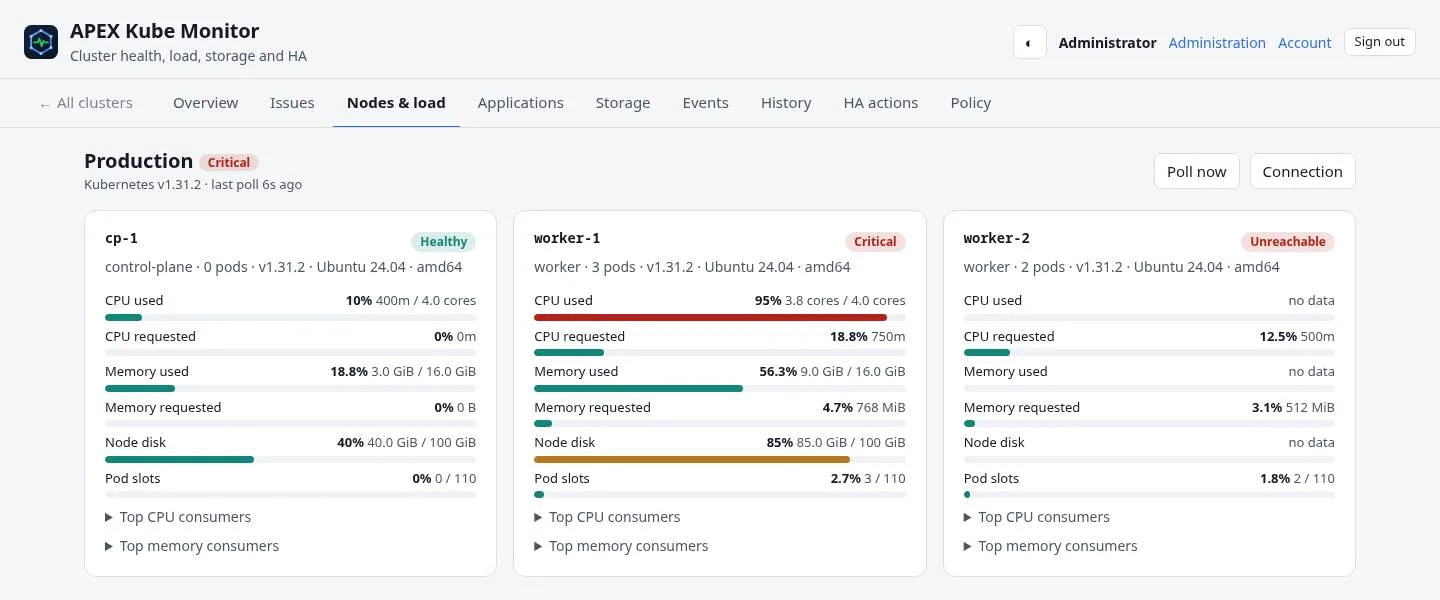
Screenshot of APEX Kube Monitor showing a simulated cluster: health score, nodes ready, applications healthy, CPU, memory and volumes, the problems that need attention with recommendations, and the load of each node
Product screenshot of a simulated cluster: health score, problems with recommendations and load per node.
30 sbetween two checks of every cluster
37kinds of problem, each with a fix
7repair actions with safety guards
3layers of access control

Overview

Answers, not just metrics

A failed server can go unnoticed while Kubernetes waits minutes before moving its applications, and some never move. A dashboard shows 95 % CPU, but not which application causes it or where it could run instead. A volume fills up, or a database turns out to live on the local disk of the one server that died.

Kube Monitor reads each cluster through the Kubernetes API and turns what it finds into problems with recommendations: the pods responsible for a load, the node with room, the single replica or the missing disruption budget that will cause the next outage, and whether the cluster survives losing a node.

When an administrator allows it, it also repairs: it moves applications off a failed server, restarts crashed pods, clears pods stuck on a dead node and grows full volumes, within guards that stop it from making a bad situation worse.

Capabilities

Monitoring, explanation and repair in one place

Every capability below exists in the current version of the product.

01

Application status

Every workload, its replicas, its nodes and its pods.

  • Deployments, StatefulSets, DaemonSets, Jobs and CronJobs, with their disruption budgets
  • Crash loops, OOM kills, image and configuration errors, pending pods
  • Single-replica and co-located applications reported before they fail
  • Warning events and a 24-hour history
02

Server load with recommendations

Know what loads each node and where the work could go.

  • CPU, memory, disk and pod slots per node, against allocatable capacity and requests
  • The pods responsible and the node with room
  • Overcommit and imbalance across nodes
  • Whether the cluster can lose a node (N-1 capacity)
03

Storage per node and application

See where the data lives before a server fails.

  • Each node's disk, and the volumes, ephemeral storage and emptyDir each application uses on it
  • Volumes filling up or running out of inodes
  • Volumes pinned to a node that is down, with the data at risk
04

Automatic high availability

Routine repairs in seconds, only when you allow them.

  • Move applications off a failed node, and put a recovered node back into service
  • Restart crash-looping pods, clear pods stuck on a dead node, remove failed pods
  • Grow a full volume when its storage class allows it; scale to two replicas on request
  • Per cluster: off, recommend (the default) or automatic
05

Safety guards

Automatic repair that cannot run away.

  • A grace period before acting, and a pause between repairs of the same object
  • A maximum number of repairs per hour and a minimum number of healthy nodes
  • No mass moves when most nodes look down at once, which usually means a network split
  • Excluded namespaces, an ignore label and self-protection
06

Access control and operations

A monitoring tool that is not open to the whole network.

  • Allow-list of IP addresses, ranges and DNS names, with lock-out protection
  • Password plus authenticator code, required by default, with recovery codes
  • Several clusters: in-cluster service account, URL and token, or kubeconfig
  • Alerts to Slack, Microsoft Teams or Mattermost; API tokens, audit log, SIEM forwarding and backups

Inside the product

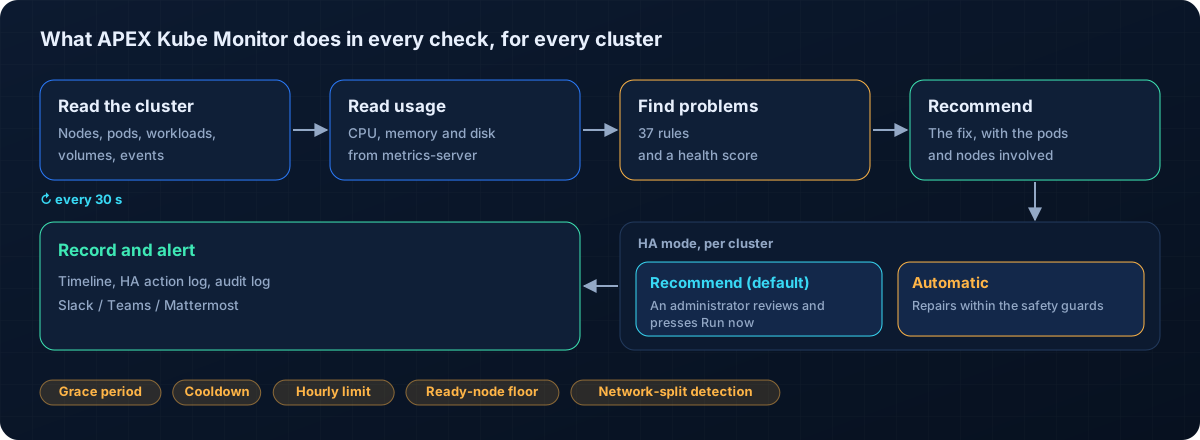
What happens in every check

Read the cluster and its usage, find the problems, recommend the fix, then repair it or let an administrator decide.

Use cases

Who uses it, and for what

Operations and platform teams

Hear about a failing node or a filling disk before users do, with the fix spelled out.

Capacity planning

See which applications load which servers, and whether the cluster survives losing one.

Resilience reviews

Find single replicas, co-located replicas, missing disruption budgets and data pinned to one server.

Small teams without night shifts

Let routine repairs happen automatically, within limits the team has agreed.

Specifications

Technical specifications

Deployment and integration details of the current version (0.1).

Inside your cluster

One instance in the cluster it watches, with a service account that may only read, plus the few changes its repairs need.

Desktop app

The same monitor on one computer, connecting to your clusters with a kubeconfig.

Cluster accessIn-cluster service account, API URL and token, or kubeconfig with inline credentials; permissions listed in one file
Data readNodes, pods, workloads, disruption budgets, volumes, storage classes, events, metrics-server and kubelet statistics
Check interval30 seconds by default, adjustable; 24-hour history with one sample per minute
Analysis37 kinds of problem with recommendations and a health score
Repairs7 actions; modes off, recommend (default) and automatic, with grace period, cooldown, hourly limit, ready-node floor and network-split detection
AlertsWebhooks to Slack, Microsoft Teams and Mattermost
SecurityAllow-list firewall, password and TOTP MFA, encrypted credentials, scrypt password hashing, hashed API tokens
OperationsAudit and activity log, JSON logs forwarded to a SIEM, backup and restore, health status for APEX Pingmora
PlatformsRuns inside a Kubernetes cluster; desktop app for Windows, macOS and Linux
Not includedIt cannot report its own cluster being entirely down (pair it with an external check such as APEX Pingmora); real usage needs metrics-server; data on local volumes cannot follow its application to another node

APEX Kube Monitor

Technical questions

Will it change our cluster without asking?

No. The default mode only recommends, and an administrator runs each repair. Automatic repair is switched on per cluster, and even then the safety guards limit what can happen.

What permissions does it need?

Read access to the cluster, plus only the changes its repairs need. The permissions are listed in one file and can be narrowed; the monitor checks them and shows what it may not do.

What if the whole cluster goes down?

A monitor inside a cluster cannot report that cluster being completely down. Pair it with an external check: APEX Pingmora reads its health status.

Do we need metrics-server?

For real CPU, memory and disk usage, yes. Without it the monitor still works, but shows requested resources instead of what is actually used.

Keep your Kubernetes clusters healthy

Book a demo and see how Kube Monitor explains each problem in a cluster and repairs the routine ones.

Contact

Let's talk about your security

Tell us about your company and what worries you. A specialist will reply with next steps and, if you want, schedule a free initial assessment or a product demo.

What happens next

  • A specialist reads your message and replies
  • A short call to understand your needs
  • A free assessment or a tailored demo

Sending opens your email app with the message ready. Nothing is stored on this website.